The following plots are generated from the CSV file provided in CSV Download.
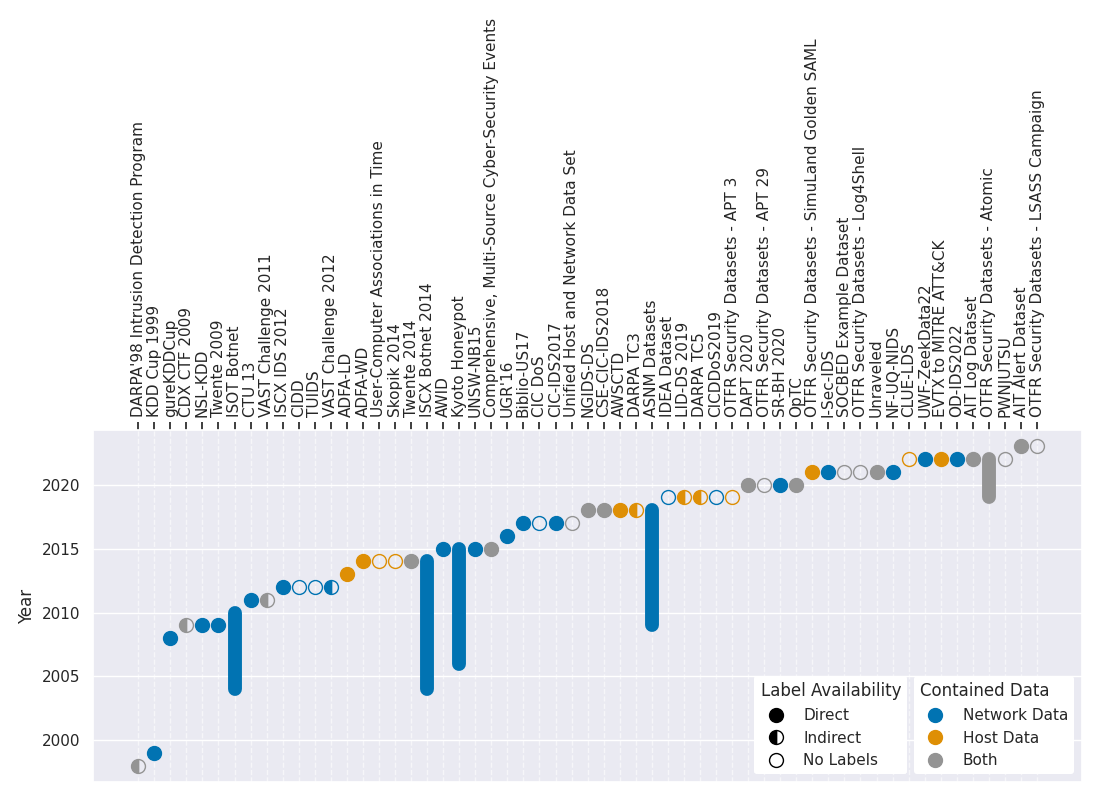
Distribution of datasets over time
This figure presents the distribution of currently surveyed datasets over time, where “time” refers to the year the underlying data was generated in, which may differ from the year of publication – if this information is not available, the latter datum is chosen instead. Datasets containing data from more than one year are represented accordingly. Additionally, data sources and label availability are shown: Data sources are grouped into “Network Data” (e.g., packet captures or network flows), “Host Data” (e.g., system logs or syscalls), and “Both” (any combination of the previous two); label availability for each dataset has been classified into either “Direct” (explicit labels for at least a subset of data), “Indirect” (meta-information allowing for manual labeling), or “No Labels”.
Even though this simplifies certain aspects, the figure provides a reasonably broad overview of the current landscape of IDS-related datasets. As an example, while the DARPA ‘98 and CSE-CIC-IDS2018 datasets contain both network and host data and are visualized as such, only their network data is labeled and thus typically used by other publications. Still, declaring these datasets to contain only network data would go beyond the purpose of a survey, as it is up to other researchers to decide whether the (in this case host) data can be utilized for their purposes.
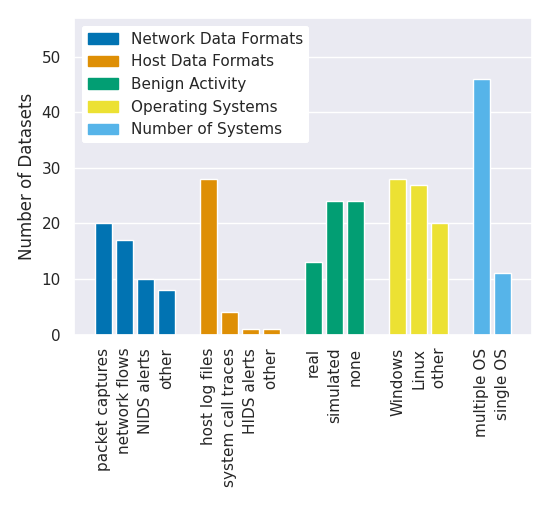
Dataset characteristics
This figure lists various characteristics of surveyed datasets, grouped into five categories: Source of network data, source of host data, how benign activity was generated, which operating systems were included, and how many systems in total were part of the scenario. Except for the final category, these classifications are not mutually exclusive – consequently, the sum of a specific category might not align with the total number of datasets surveyed. This discrepancy occurs because some datasets, for example, do not include network data, while others may include multiple operating systems, affecting the sums respectively.